Crazy for Chem
Swati Hunge (Chemistry Educator)
Modern Instrumental Methods in Analytical Chemistry
Modern instrumental methods serve as the foundation of analytical chemistry, leveraging advanced automated technology for precise molecular analysis. While spectroscopy identifies functional groups and solves structural elucidation puzzles by measuring radiation interactions, chromatography isolates components within complex mixtures using distinct separation metrics to achieve absolute baseline resolution.
🧪 Click the card to explore
The shift from classical wet chemistry to modern instrumental analysis marks a fundamental evolution in chemical precision.
Traditional techniques, such as manual titrations, face limitations due to high labour requirements, low sensitivity, and the need for large sample volumes.
In contrast, modern instrumental methods offer high-speed data acquisition, automated functionality, and detection limits at the parts-per-billion (ppb) or parts-per-trillion (ppt) scale.
By integrating electronics and computer science, these techniques enable non-destructive testing of minute samples, preserving material integrity for further study while ensuring rigorous quality control in contemporary laboratories.
Table of Contents
Fundamentals of Spectroscopy: Probing Matter with Radiation
UV-Visible Spectroscopy: Electronic Transitions and Pharmaceutical Compliance
UV-Vis spectroscopy examines absorption of radiation in the 180–1100 nm range.
This absorption stems from the interaction of photons with the outermost electrons of atoms or ions, facilitating electronic transitions from the highest occupied molecular orbital (HOMO) to the lowest unoccupied molecular orbital (LUMO).
Organic systems primarily utilise π → π* and n → π* transitions, with the specific wavelength of maximum absorption designated as λmax.
The position of λmax serves as a structural indicator; increased conjugation induces a bathochromic (red) shift, moving absorption to longer wavelengths.
Quantitative accuracy is governed by the Beer-Lambert Law, establishing a linear relationship between absorbance and concentration.
Industrial Validation: In pharmaceutical Quality Control (QC) laboratories, maintaining instrument accuracy is a regulatory mandate. Compliance with United States Pharmacopoeia (USP) or Indian Pharmacopoeia (IP) standards requires routine calibration checks. A primary example is the use of potassium dichromate standard solutions to verify photometric accuracy and linearity. If the absorbance values deviate from established benchmarks, the instrument fails qualification, halting the release of medicinal batches.
Infrared (IR) Spectroscopy: Molecular Springs and Functional Groups
Infrared spectroscopy identifies functional groups by measuring bond vibrations in the mid-IR region λmax. According to Hooke’s Law, these chemical bonds behave like different-sized springs. A heavy atom attached to a loose “spring” (a single bond) vibrates at a lower frequency, whereas a light atom on a tight “spring” (a triple bond) vibrates much faster.
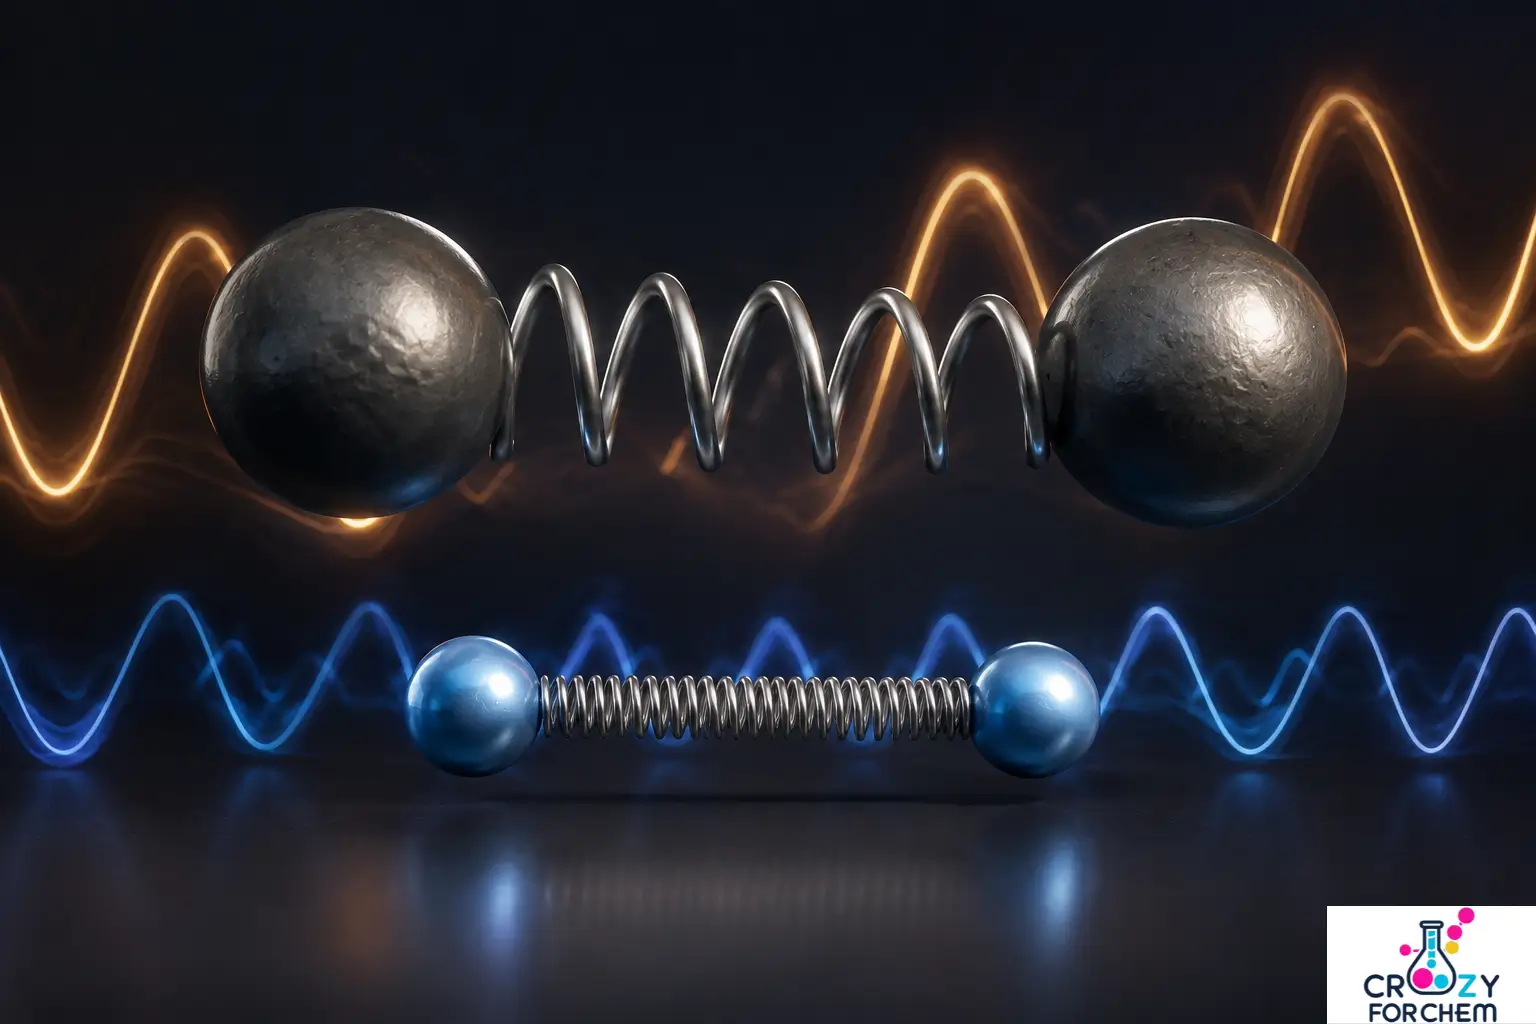
Modern Fourier Transform Infrared (FTIR) spectrometers use a Michelson interferometer to provide superior signal-to-noise ratios and energy throughput compared to older dispersive models.
In forensic science and polymer engineering, Attenuated Total Reflection (ATR) has become the standard for rapid sampling, yet the reliability of the resulting spectra depends entirely on meticulous bench discipline.
A common pitfall in busy labs is the accumulation of microscopic residues or atmospheric oils on the ATR crystal from previous runs.
This contamination inevitably distorts the baseline and introduces ghost peaks that can lead to catastrophic errors in data interpretation.
To prevent the accidental misidentification of a controlled substance or a high-performance polymer, analysts must enforce a strict protocol of solvent-cleaning and background-checking the crystal surface between every single measurement.
Similarly, within large-scale pharmaceutical formulation plants, operators often determine the technical success of an HPLC run long before they even inject the sample.
Professional lab protocols require that the mobile phase be completely degassed using sonication or inline vacuum systems to get rid of any gases that are dissolved in it.
Skipping this fundamental step allows tiny air bubbles to become lodged within the pump heads or the detector’s flow cell, manifesting as erratic pressure spikes and excessive baseline noise.
Such fluctuations not only obscure trace impurities but can also lead to a failure in data integrity during a regulatory audit, potentially resulting in the quarantine or rejection of an entire production batch.
Nuclear Magnetic Resonance (NMR): The Carbon-Hydrogen Skeleton
NMR probes the magnetic properties of nuclei with a non-zero spin, such as ¹H or ¹³C. In an external magnetic field (B₀), these nuclei occupy discrete energy states. Absorption of radiofrequency radiation occurs at the Larmor frequency, causing the nuclei to precess.
Interpretation relies on the chemical shift (reported in ppm), which indicates the local electronic environment.
Spin-spin splitting (n+1 rule) provides data on adjacent, non-equivalent nuclei, allowing for the total structural elucidation of complex organic molecules. Pulsed FT-NMR techniques facilitate multidimensional analysis (2D/3D), crucial for biomolecular research.
Mass Spectrometry: The Analytical Wind Tunnel
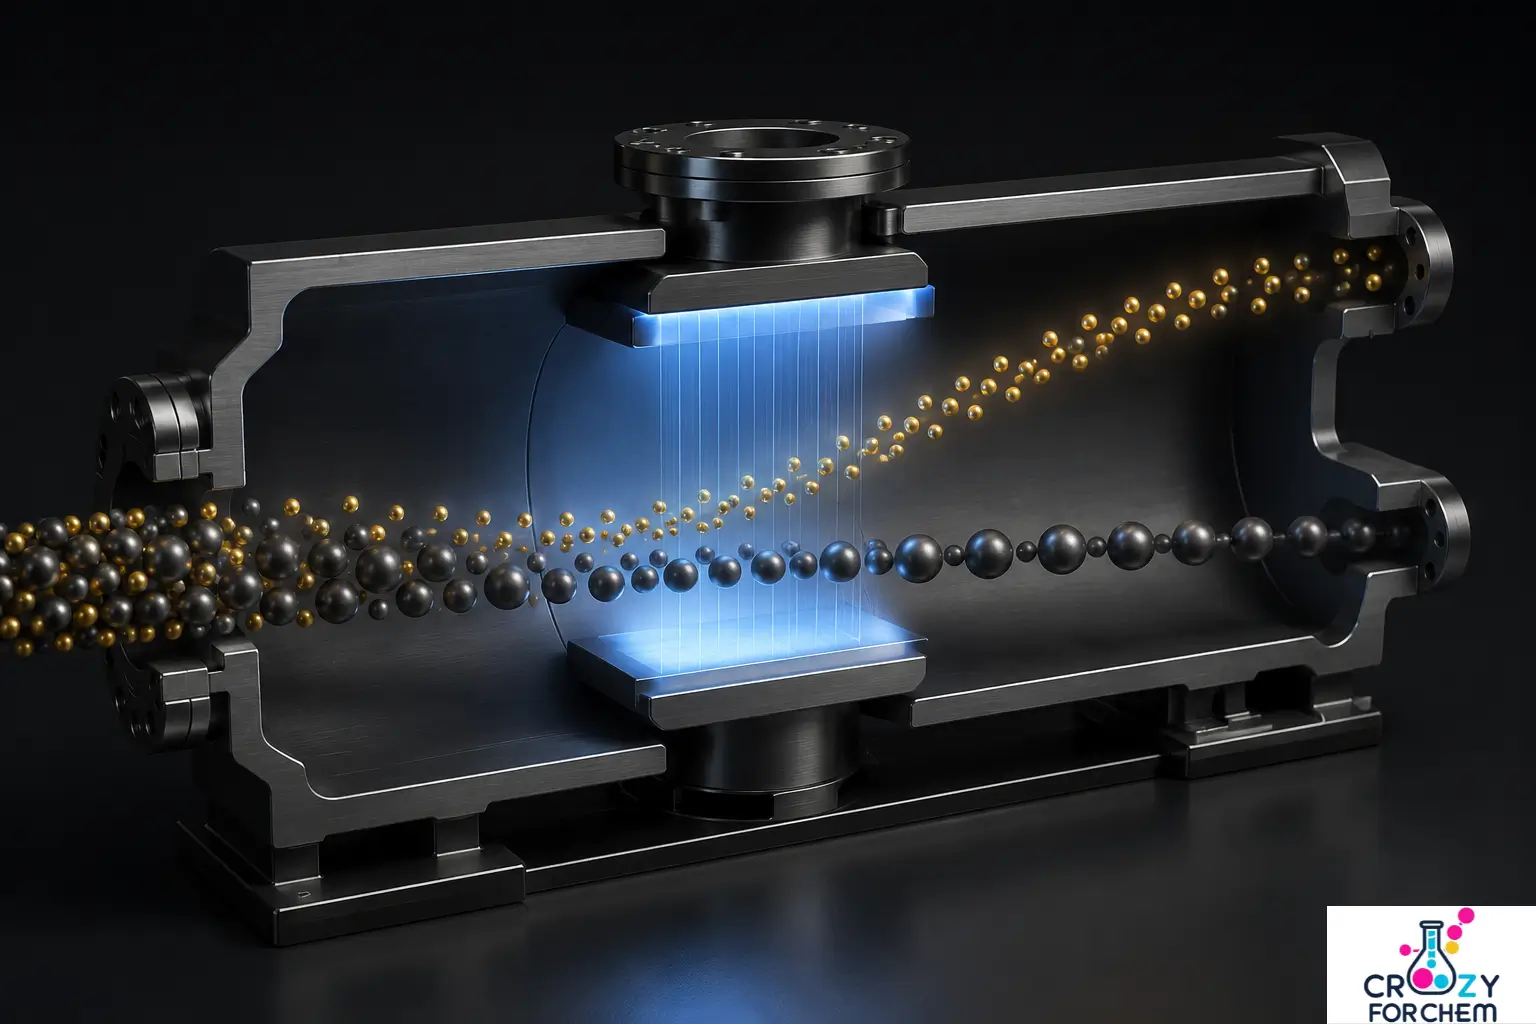
Mass spectrometry (MS) characterises matter by the mass-to-charge (m/z) ratio of gas-phase ions. For conceptual clarity, the mass analyser behaves like a physical wind tunnel.
As ions are accelerated through the analyser, the “wind” (magnetic or electric fields) deflects them.
Just as a light leaf is blown further and faster than a heavy stone in a tunnel, lighter ions are deflected or travel through the analyser faster than heavy ones, allowing the detector to sort them by their specific weight.
- Ionisation: Hard methods like electron ionisation (EI) provide predictable fragmentation (e.g., α-cleavage), while soft methods like MALDI or ESI are essential for intact protein analysis.
- Analysers: Modern labs use quadrupoles, ion traps, or Time-of-Flight (TOF) systems. TOF analysers measure the exact velocity of ions, while high-resolution mass spectrometry (HRMS) provides molecular formulae to four decimal places.
Modern Chromatography: The Science of Separation
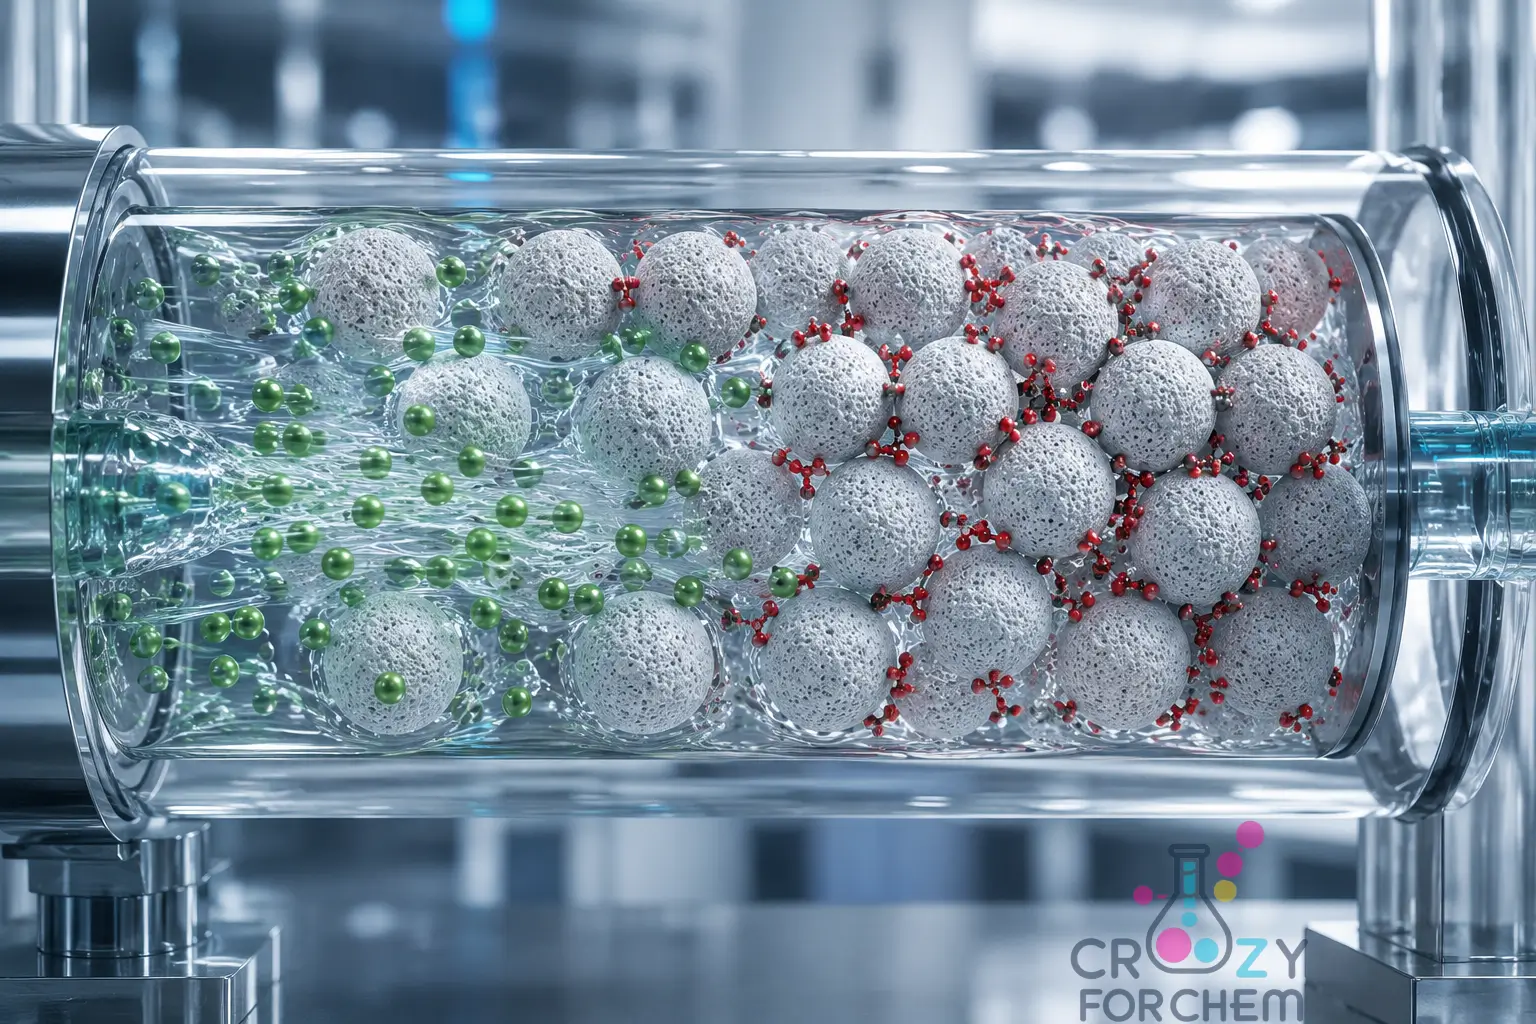
The fundamental principle of chromatography involves the differential partitioning of components between a mobile phase and a stationary phase.
Conceptually, this interaction mirrors people on an airport travelator. The travelator represents the mobile phase, while the surrounding airport shops represent the stationary phase.
Individuals with low affinity for the shops remain on the belt and walk fast, exiting the gate early. Conversely, those with a high affinity stop to browse, lagging.
This difference in “interaction time” leads to the distinct separation of individuals or molecules at the exit gates.
Separation Dynamics and the Resolution Metric
This partitioning is quantified by the Nernst partition coefficient (K), representing the ratio of solute concentration in the stationary phase to that in the mobile phase.
While column efficiency is often described by the Height Equivalent to a Theoretical Plate (HETP) and the Van Deemter equation, the ultimate measure of chromatographic success is Resolution (Rₛ).
Resolution is mathematically defined by the following equation:
Rₛ = 2(tR2 – tR1) / (W₁ + W₂)
Here, tR represents retention time, and W represents the peak width at the base.
In industrial pharmaceutical and analytical laboratories, the benchmark for absolute baseline separation is Rₛ > 1.5. Any value below this threshold indicates peak overlapping, which compromises quantitative accuracy and regulatory compliance.
The Analytical Decision Tree: GC vs HPLC
Selecting the appropriate chromatographic technique is a critical step that depends on the physical properties of the analyte.
- Gas Chromatography (GC): Chosen for compounds that are thermally stable and volatile. If a molecule can be vaporised without decomposing, GC provides superior speed and resolution.
- High-Performance Liquid Chromatography (HPLC): Utilised for thermolabile (heat-sensitive), high-molecular-weight, or highly polar compounds (such as proteins or large drug molecules) that would degrade under the high temperatures of a GC oven.
High-Performance Liquid Chromatography (HPLC): Precision and Maintenance
HPLC utilises high-pressure pumps to force a liquid mobile phase through a column packed with micro-particles (2–5 μm). In reversed-phase mode, the non-polar stationary phase (typically C18-bonded silica) interacts with analytes in a polar mobile phase.
In the high-stakes environment of pharmaceutical formulation plants, the technical success of an HPLC run is often decided long before a sample ever reaches the injector.
Professional laboratory protocols require the mobile phase to undergo thorough degassing, usually by sonication or inline vacuum systems, to remove dissolved gases.
Neglecting this fundamental preparation allows microscopic air bubbles to lodge themselves within the reciprocating pump heads or the detector’s flow cell.
The resulting erratic pressure spikes and “sawtooth” baseline noise do more than just obscure trace impurities; they represent a significant compromise in data integrity.
During a regulatory audit, such unstable chromatograms can lead to the immediate quarantine or rejection of entire production batches, as the reliability of the concentration data is called into question.
This level of operational discipline also extends to the spectroscopy bench. In forensic science and polymer engineering, Attenuated Total Reflection (ATR) is favoured for its speed; however, the resulting spectra are only as reliable as the analyst’s cleaning habits.
The accumulation of invisible residues or skin oils on the ATR crystal from previous runs inevitably distorts the baseline and introduces spurious peaks.
To avoid the catastrophic misidentification of a controlled substance or a polymer grade, lab standards require meticulous solvent-cleaning and background-check of the crystal surface between every single measurement.
Ensuring a pristine optical interface is the only way to guarantee that the final “fingerprint” belongs solely to the sample under investigation.
Gas Chromatography (GC): Volatiles and Derivatisation
GC employs an inert carrier gas (helium or nitrogen) to move vapourised analytes through a temperature-controlled capillary column. Separation is influenced by the phase ratio (β) and the chemical nature of the stationary phase film.
Forensic and Environmental Use Case: In air quality monitoring or forensic toxicological screening, many volatile organic compounds (VOCs) or drug metabolites possess polar functional groups that hinder their volatility or cause “peak tailing”. To resolve this issue, analysts employ chemical derivatisation. By reacting the sample with reagents like BSTFA (N,O-bis(trimethylsilyl)trifluoroacetamide), polar groups are replaced with non-polar silyl groups. This increases volatility and thermal stability, allowing for high-sensitivity detection in GC-MS systems.
Thin Layer Chromatography (TLC): Rapid Screening
Thin-layer chromatography serves as a cost-effective precursor to instrumental methods. Components migrate via capillary action, and their progress is quantified by the retardation factor (Rf):
Rf = Distance travelled by the substance / Distance travelled by the solvent front
High-Performance TLC (HPTLC) enhances this classical approach through automated application and finer stationary phase particles, providing the resolution required for modern purity testing and reaction monitoring.
The Van Deemter Equation: eddy diffusion, longitudinal diffusion, and mass transfer resistance
In liquid and gas chromatography, the Van Deemter equation is the fundamental mathematical model used to describe the relationship between column efficiency (expressed as HETP) and the linear velocity of the mobile phase.
For a research-level audience, it provides a roadmap for minimising band broadening to achieve maximum resolution.
The equation is expressed as:
H = A + B/u + C·u
Where:
- H is the height equivalent to a theoretical plate (HETP). Smaller H values signify higher column efficiency.
- u is the linear velocity of the mobile phase (average flow rate).
- A, B, and C are constants representing specific physical phenomena occurring within the column.
1. The A Term: Eddy Diffusion (The Multiple Path Effect)
The “A” term accounts for the multiple paths a solute molecule can take through a packed column. Because the packing particles are not perfectly uniform, some paths are shorter and faster, while others are longer and more circuitous.
- Physical Mechanism: Molecules starting at the same point will reach the end of the column at different times because of these varied trajectories.
- Dependency: This term is independent of flow rate (u). It depends primarily on the particle size (dp) and the quality of the packing (λ).
- Research Implication: Modern chromatography minimises this term by using ultra-pure, spherical, and monodisperse particles. In open tubular capillary columns (GC), the A term is zero because there is no packing material to create multiple paths.
2. The B Term: Longitudinal Diffusion
The B term represents the natural tendency of molecules to diffuse from an area of high concentration (the centre of the solute band) to an area of low concentration (the edges).
- Physical Mechanism: As the band moves through the column, it spreads out axially over time.
- Dependency: This effect is inversely proportional to velocity (1/u). If the mobile phase moves very slowly, the solute stays in the column longer, allowing more time for diffusion to occur.
- Research Implication: To minimise the B term, higher flow rates are preferred. This is particularly critical in gas chromatography (GC), where gaseous diffusion coefficients are 10⁴ to 10⁵ times higher than in liquids.
3. The C Term: Resistance to Mass Transfer
The C term describes the time required for a solute molecule to equilibrate between the mobile and stationary phases.
- Physical Mechanism: Separation requires the solute to move back and forth between phases. If the mobile phase moves too quickly, the solute “misses” the opportunity to fully interact with the stationary phase, or it gets “stuck” in the stationary phase while the mobile phase band moves ahead.
- Dependency: This term is directly proportional to velocity (C·u). Fast flow rates exacerbate the equilibrium lag, causing band broadening.
- Research Implication: The C term is reduced by using thinner stationary phase films or smaller, porous particles (shortening the diffusion distance). This phenomenon is why UPLC (Ultra-Performance Liquid Chromatography) uses sub-2 μm particles to minimise the C term and enable high-speed analysis without losing efficiency.
The Van Deemter Plot and uopt
The visual representation of this equation is a hyperbolic curve. By plotting H against u, the optimum linear velocity (uopt) can be identified, where H is at its minimum (the point of maximum efficiency).
Van Deemter Equation Visualiser
Optimal Velocity (uopt)
1.73
Minimum Plate Height (Hmin)
0.673
Summary Table for Method Optimisation
| Term | Source | Fix for Researchers |
| A (Eddy) | Poor packing / Large particles | Use smaller, uniform particles or capillary columns. |
| B (Longitudinal) | Molecular diffusion | Increase flow rate (u) to reduce residence time. |
| C (Mass Transfer) | Slow equilibrium | Use smaller particles or thinner stationary-phase films. |
Practical Application: In modern laboratory settings, the shift toward core-shell particles and superficially porous particles (SPPs) specifically targets the reduction of the C term. By providing a solid core, the solute does not have to diffuse deep into the particle, allowing for much faster equilibration and maintaining low H values even at high velocities.
Industrial and Pharmaceutical Applications
Quality Control in Drug Manufacturing
In the pharmaceutical sector, modern instrumental methods are the standard for verifying the safety and purity of every medicinal batch.
HPLC serves as the primary tool for assay development, measuring active pharmaceutical ingredient (API) concentrations and identifying minute impurities that could compromise patient safety.
Compliance with pharmacopoeial standards, such as those set by the USP or IP, necessitates the use of validated protocols and high-sensitivity detectors.
For instance, coupling HPLC with mass spectrometry (MS) allows for the detection of trace contaminants and the determination of optical purity in racemic mixtures, ensuring that only the therapeutically active isomer is present.
Environmental Monitoring and Pollutant Detection
Environmental labs rely on the high selectivity of instruments to track pollutants across air, water, and soil.
ICP-MS is the preferred choice for detecting heavy metals in drinking water at sub-ppb levels, providing a level of detail that manual testing cannot reach.
For atmospheric analysis, GC-MS identifies volatile organic pollutants, while portable infrared sensors enable on-site tracking of greenhouse gases like carbon monoxide.
Furthermore, hyphenated techniques like HPLC-OES allow for speciation analysis, which is vital for identifying the specific chemical forms of an element, such as distinguishing between toxic and non-toxic mercury compounds.
Future Trends in Instrumental Analysis
Miniaturisation and Green Chemistry
The industry is moving toward extreme miniaturisation to support both clinical diagnostics and “green analytical chemistry”.
Technologies such as Nano-LC and capillary electrophoresis (CE) are known for gathering data in seconds while using a fraction of the solvents required by traditional systems.
The development of “lab-on-a-chip” devices integrates entire workflows onto a single microfluidic platform, significantly reducing chemical waste.
Portable mass spectrometers now allow forensic and food safety teams to perform immediate analysis directly in the field, bypassing the need for remote laboratory transport.
The Role of Artificial Intelligence
Machine learning is changing how labs handle the massive datasets produced by hyphenated systems.
AI algorithms are now used for automated pattern recognition in complex mass spectra, often spotting structural nuances that a human analyst might overlook.
During method development, intelligent software can simulate thousands of chromatographic conditions to find the optimal separation parameters instantly.
Chemometric tools, such as Principal Component Analysis (PCA), are also being applied to infrared imaging to map chemical species within heterogeneous solids, creating a new layer of depth in materials science.
Conclusion: Achieving Analytical Excellence
Modern labs prefer automated, high-precision sensors over manual techniques because they provide the reliability needed for complex tasks such as protein sequencing or environmental trace detection.
The transition from glass flasks to digital instrumentation has made analytical chemistry a high-throughput discipline, delivering results with unprecedented speed and accuracy.
As hardware becomes more compact and software more intelligent, we will only continue to grow our ability to solve intricate chemical puzzles.
Mastering these instrumental suites is no longer optional for those seeking to lead in research or industrial quality control.
Frequently Asked Questions
What instruments are common in UV-visible spectroscopy?
UV-visible spectroscopy primarily relies on single-beam and double-beam spectrophotometers to measure light absorption. These instruments quantify how much near-ultraviolet or visible radiation a chemical sample absorbs across a specific wavelength spectrum.
The core components include a stable light source (typically a deuterium lamp for the UV region and a tungsten filament lamp for visible light), a monochromator (diffraction grating) to isolate specific wavelengths, a sample holder (quartz cuvettes), and a detector such as a photomultiplier tube (PMT) or a photodiode array (PDA). In industrial practice, double-beam configurations are preferred because they split the light to monitor the sample and a reference blank simultaneously, automatically correcting for source intensity fluctuations and solvent background noise.
What instrument is used in IR spectroscopy?
Fourier Transform Infrared (FTIR) spectrometers are the standard instruments used in modern infrared spectroscopy. These devices identify functional groups by monitoring how chemical bonds stretch or bend when exposed to infrared radiation.
FTIR systems equipped with a Michelson interferometer have systematically replaced older dispersive instruments. This assembly uses a beam-splitter, a fixed mirror, and a moving mirror to generate an interferogram, capturing all infrared frequencies simultaneously. This time-domain signal is subsequently decoded into a frequency-domain spectrum via a Fourier transform calculation, offering massive advantages in energy throughput and wavelength precision over single-wavelength scans.
How does the instrumentation of IR spectroscopy work?
An IR spectrometer functions by passing an infrared beam through a sample and measuring which specific frequencies cause molecular vibrations. The instrument records the reduction in beam intensity at distinct wavenumbers, producing a characteristic chemical fingerprint.
In a standard Attenuated Total Reflection (ATR) setup, the infrared beam is sent into a high-refractive-index crystal, like diamond or zinc selenide, that is very close to the sample. The beam reflects internally off the crystal face, creating an evanescent wave that penetrates a few microns into the sample material. Solute bonds absorb specific frequencies matching their natural vibrational states, and the altered beam exits the crystal to a pyroelectric detector (like deuterated triglycine sulphate, or DTGS), where the raw interferogram is processed into a transmittance spectrum.
What are the important principles and instrumentation of NMR spectroscopy?
Nuclear Magnetic Resonance (NMR) spectroscopy operates on the principle that certain atomic nuclei possess a magnetic spin and precess at a specific frequency when placed in an external magnetic field. Absorption of radiofrequency energy occurs when the applied pulse matches this precession speed, causing the nuclei to resonate.
The primary instrumentation consists of an ultra-powerful superconducting magnet cooled by liquid helium, a radiofrequency (RF) transmitter, a probe that holds the sample tube, and a receiver to detect the resonance signals. As the excited nuclei return to their ground state, they emit a Free Induction Decay (FID) signal. The computer processes this time-domain signal into a conventional spectrum where peak positions (chemical shifts in ppm) reveal the electronic shielding, and peak splitting reveals the arrangement of the carbon-hydrogen skeleton.
What is an instrument response function in physical chemistry spectroscopy?
The instrument response function (IRF) represents the inherent distortion or broadening introduced into a spectral measurement by the physical limitations of the instrument itself. It defines how an analytical system would record a theoretically instantaneous or infinitely sharp physical event.
Mathematically, the observed experimental spectrum (Iobs(t)) is the convolution of the true, uncorrupted physical signal (Itrue(t)) with the instrument response function (IRF(t)):
Iobs (t) = Itrue(t) * IRF(t)
In time-resolved laser spectroscopy, such as fluorescence lifetime measurements, the finite width of the laser pulse and the transit-time jitter of the photomultiplier tube limit the system’s time resolution. Researchers must measure the IRF using a non-fluorescent scattering sample and use mathematical deconvolution algorithms to extract the true, sub-nanosecond molecular decay data accurately.

Founder · CrazyForChem
Chemistry Educator | Organic Chemistry Expert | M.Sc. Organic Chemistry
Helping Students & Teachers Master Chemistry. I’m a passionate chemistry educator who loves making chemistry simple, relatable, and fun. With a background in Organic Chemistry, I help students not only understand concepts but also explore the many career paths chemistry can lead to.