

Mass Spectrometry: Fragmentation Patterns & Molecular Ion Peak
Mass spectrometry ionises molecules (70 eV electron impact) and sorts the resulting gas-phase cations by m/z. The molecular ion M⁺• gives the molecular mass, the base peak is the tallest fragment (100%), and M+1 / M+2 isotope peaks reveal carbon count and Cl, Br or S. Cleavage follows Stevenson’s rule, while the Nitrogen rule and Rule of 13 turn M⁺ into a molecular formula.
🧪 Click the card to explore
Mass spectrometry finds the relative molecular mass, formula and structure of organic molecules by measuring the mass-to-charge ratio (m/z) of gas-phase ions. Unlike UV-Vis or IR it does not measure absorbed radiation — it is micro-destructive: neutral molecules are ionised, fragmented and sorted by m/z.
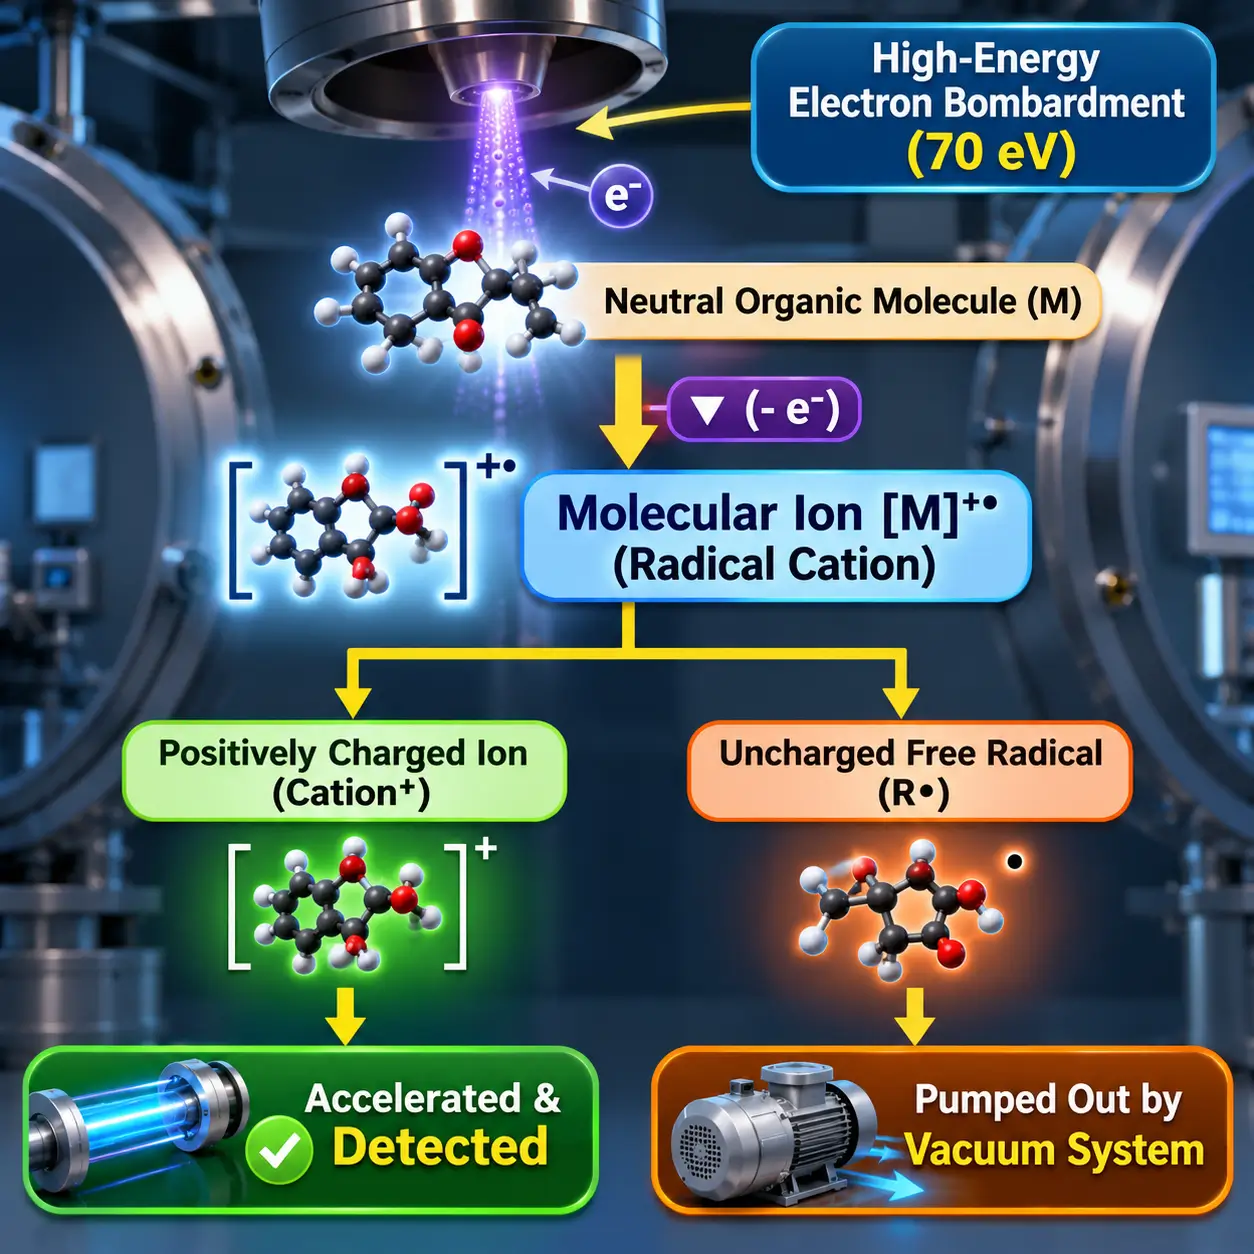
In electron ionisation (EI), a 70 eV electron beam removes one electron to form the molecular radical cation M⁺•. That energy exceeds typical bond energies, so M⁺• breaks into cations and neutral radicals. Only charged fragments are deflected and detected; neutral radicals are pumped away unseen. Almost all ions have z = +1, so m/z equals the ion’s mass. The output is a stick plot of relative abundance against m/z.
M + e⁻ (70 eV) → [M]⁺• + 2 e⁻
[R–R′]⁺• → R⁺ + R′•   (only the cation is detected)
1. Inlet & vapourisation — high vacuum (10⁻⁵–10⁻⁷ mbar) and gentle heating give isolated gas-phase molecules.
2. Ionisation — 70 eV electrons from a heated filament remove the easiest electron (non-bonding n → π → σ), forming M⁺•.
3. Acceleration — repeller plates and lenses form a beam of uniform kinetic energy.
4. Mass analysis — magnetic sector, quadrupole or TOF separates ions by m/z; in a magnetic sector, lighter ions deflect more.
5. Detection — an electron multiplier or Faraday cup turns ion arrival into current; signals are normalised to the tallest peak.
GC-MS: hard EI at 70 eV gives rich, reproducible fragmentation that can be matched against NIST or Wiley libraries.
LC-MS: soft ESI or APCI ionises polar, non-volatile or thermolabile molecules gently. Look for [M+H]⁺ (M+1), [M+Na]⁺ (M+23) and [M+K]⁺ (M+39) instead of M⁺•.
MS/MS: MS1 isolates one precursor ion; in a collision cell with argon it undergoes collision-induced dissociation (CID); MS2 then resolves the product ions.
Molecular ion (M⁺•): the intact radical cation at the highest nominal m/z (ignoring M+1 and M+2 satellites). Its position is the molecular mass — pentane (C₅H₁₂) shows M⁺• at m/z 72.
Base peak: the tallest line, set to 100%. It is the most stable, most abundant fragment — a tertiary carbocation, acylium, oxonium/iminium or tropylium ion.
Relative abundance (%) = (peak height ÷ base peak height) × 100
To validate a candidate M⁺•, check the losses below it: M−15 (CH₃•), M−18 (H₂O), M−29 (C₂H₅• or CHO•), M−45 (OC₂H₅• or COOH•). A gap of 3–14 units is chemically improbable, so that candidate is wrong. Aldehydes, alcohols, primary amines and nitriles often show a prominent M−1 from loss of H•.
Natural ¹³C abundance is about 1.1%, so every carbon adds 1.1% to the M+1 peak. A C₁₀ compound shows M+1 at roughly 11% of M⁺.
nC ≈ [ (M+1) height ÷ M⁺ height ] × (100 ÷ 1.1)
One Cl (³⁵Cl 75.5%, ³⁷Cl 24.5%): M : M+2 ≈ 3 : 1.
One Br (⁷⁹Br 50.5%, ⁸¹Br 49.5%): M : M+2 ≈ 1 : 1.
One S (³⁴S 4.25%): M+2 ≈ 4.4% of M⁺.
Several halogens follow a binomial expansion: CH₂Cl₂, from (0.7576 + 0.2424)², gives m/z 84, 86, 88 at 100 : 64 : 10, and 1,2-dibromoethane gives 1 : 2 : 1.
When M⁺• cleaves at a single bond, the positive charge stays on the fragment with the lower ionisation energy and the radical forms on the other. Lower ionisation energy means a more stable cation, so the most stable carbocation dominates: 3° > 2° > 1° > CH₃⁺. In 2-methylbutane, loss of CH₃• gives an intense sec-butyl cation at m/z 57, while CH₃⁺ at m/z 15 is negligible.
[R–R′]⁺• → R⁺ (lower IE) + R′• (higher IE)
A neutral molecule of C, H, O, S, P and halogens has an even nominal M⁺ if it contains zero or an even number of N atoms, and an odd M⁺ if it contains an odd number of N atoms. Nitrogen has an even mass (14) but an odd valency (3), whereas C, O and S have even masses and even valencies.
For single-bond cleavage, an even-mass M⁺• without N gives an odd-mass cation; an odd-mass M⁺• with one N gives an even-mass N-containing cation.
Treat the molecule as CH units of mass 13 (12 + 1) to get a candidate formula from the nominal mass M:
M ÷ 13 = n + r/13   →   base formula CₙHₙ₊ᵣ
U = (n − r + 2) ÷ 2   (rings + π bonds)
Add heteroatoms by swapping CHₓ units: O → remove CH₄, add O (16). N → remove CH₂, add N (14). Cl → remove C₂H₁₁, add Cl (35).
Example: M = 78 → 78 ÷ 13 = 6 remainder 0 → C₆H₆, U = 4 (benzene).
Usually one of three ions: the propyl cation [C₃H₇]⁺ (unbranched alkanes such as pentane), the acetyl acylium ion [CH₃CO]⁺ (methyl ketones and esters, by α-cleavage) or the isopropyl cation [(CH₃)₂CH]⁺ (branched alkanes and secondary halides such as 2-bromopropane).
1. Find M⁺ and apply the Nitrogen rule.
2. Check M+1 (carbon count) and M+2 (Cl, Br, S).
3. Identify the base peak: tertiary cation, acylium (43, 57, 105), oxonium (31), iminium (30) or tropylium (91).
4. Calculate logical losses (M − X).
5. Propose mechanisms — Stevenson’s rule, α-cleavage, McLafferty rearrangement — and confirm every peak fits the structure.
| Loss | Lost fragment |
|---|---|
| M − 1 | H• (aldehydes, alcohols, amines, nitriles) |
| M − 15 | CH₃• |
| M − 18 | H₂O |
| M − 28 | CO or C₂H₄ |
| M − 29 | C₂H₅• or CHO• |
| M − 31 | OCH₃• |
| M − 45 | OC₂H₅• or COOH• |
| m/z | Diagnostic ion | Typical source |
|---|---|---|
| 91 | Tropylium [C₇H₇]⁺ | Alkylbenzenes |
| 57 | tert-Butyl or propionyl | Branched alkanes, pentan-3-one |
| 43 | Propyl, acetyl or isopropyl | Alkanes, methyl ketones, 2-bromopropane |
| 31 | [CH₂=OH]⁺ | Primary alcohols |
| 30 | [CH₂=NH₂]⁺ | Primary aliphatic amines |
| 29 | Ethyl [C₂H₅]⁺ | Pentane, pentan-3-one, bromoethane |
| Compound | M⁺• | Base peak | Key fragments |
|---|---|---|---|
| Pentane | 72 | 43 (C₃H₇⁺) | 57, 29, 15 |
| 2-Methylbutane | 72 (faint) | 43 (isopropyl) | 57 (M−15) |
| Pentan-3-one | 86 | 57 (CH₃CH₂CO⁺) | 29 |
| Toluene | 92 (intense) | 91 (tropylium) | 65 (−C₂H₂) |
| Bromoethane | 108 / 110 (1:1) | 29 (C₂H₅⁺) | — |
Fundamentals and Working Principles of Mass Spectrometry
Table of Contents
What is Mass Spectrometry and its Core Principle?
Mass spectrometry is an analytical technique used to determine the relative molecular mass, chemical formula, and structural architecture of organic molecules by measuring the mass-to-charge ratio (m/z) of gas-phase ions.
Unlike optical spectroscopic methods such as Ultraviolet-Visible (UV-Vis) or Infrared (IR) spectroscopy, which measure the absorption or emission of electromagnetic radiation, mass spectrometry is a micro-destructive technique that converts neutral sample molecules into charged species and separates them based on mass-to-charge ratio.
The core operational principle involves vaporising an organic analyte and introducing it into an ionisation chamber, where high-energy electron bombardment removes a single electron from the molecule. This generates a positively charged radical cation known as the molecular ion.
Because the energy transferred during electron impact typically exceeds the bond dissociation energies within the organic framework, the molecular ion undergoes unimolecular decay, producing smaller charged fragments and neutral radical species.
Analysing mass spectrometry fragmentation patterns provides a systematic blueprint of how chemical bonds break, allowing chemists to reconstruct the complete structural formula of unknown compounds.
The visual output of a mass spectrometer is represented as a stick plot or bar graph displaying relative ion abundance on the vertical axis against the (m/z) ratio on the horizontal axis.
Because the vast majority of ions generated carry a single positive charge (z = +1), the measured (m/z) value directly corresponds to the nominal mass of the detected cation.
Uncharged neutral fragments and free radicals generated during bond cleavage do not register on the detector because magnetic and electric fields deflect only charged particles; uncharged species are continuously evacuated from the instrument by high-vacuum pumps.
This detailed analysis forms a crucial part of our comprehensive guide on Modern Instrumental Methods.
The 5 Stages of Mass Spectrometry
To transform a liquid or solid sample into a resolved mass spectrum, the instrument processes the analyte through 5 stages of mass spectrometry under high vacuum conditions:
- Sample Inlet and Vapourisation: The sample is introduced via a direct insertion probe or hyphenated gas/liquid chromatographic interface. High vacuum (typically 10-5 to 10-7 mbar) and gentle heating vapourise the analyte into individual gas-phase molecules to prevent intermolecular collisions.
- Ionisation: Vapourised molecules enter the ion source and cross a high-energy electron beam emitted from a heated tungsten or rhenium filament, typically operating at 70 electronvolts (eV). The impact dislodges a valence electron from the site of lowest ionisation energy (non-bonding electrons > π-electrons > σ-electrons), producing a molecular radical cation (M⁺•).
- Acceleration: Negatively charged repeller plates and electrostatic focusing lenses accelerate the newly generated positive ions into a parallel beam with uniform kinetic energy.
- Deflection and Mass Analysis: The accelerated ion beam enters the mass analyser, such as a magnetic sector, quadrupole mass filter, or Time-of-Flight (TOF) drift tube, which separates ions based on their unique (m/z) ratios. In a magnetic sector instrument, an applied magnetic field (B) forces ions into a circular trajectory, where ions with smaller (m/z) ratios experience greater deflection than heavier species.
- Detection and Signal Processing: Separated ions strike an electron multiplier or Faraday cup detector, generating a microampere electrical current proportional to the number of arriving ions. Computerised data systems normalise the resulting signal heights relative to the most intense peak, outputting the final mass spectrum.
Overview of Spectral Outputs: LC-MS vs GC-MS
Modern analytical laboratories frequently combine mass spectrometry with chromatographic separation, yielding hyphenated interfaces such as Gas Chromatography-Mass Spectrometry (GC-MS) and Liquid Chromatography-Mass Spectrometry (LC-MS).
- GC-MS Spectral Profiles: GC-MS typically utilises hard Electron Ionisation (EI) at 70 eV. Because 70 eV transfers significant internal energy to the sample, EI spectra exhibit extensive, highly reproducible fragmentation patterns that can be searched directly against digital spectral libraries (e.g., NIST or Wiley).
- LC-MS Spectral Profiles and Reading LC-MS Results: LC-MS employs soft ionisation techniques such as Electrospray Ionisation (ESI) or Atmospheric Pressure Chemical Ionisation (APCI) to ionise polar, non-volatile, or thermolabile biomolecules without extensive thermal breakdown. Reading LC-MS results requires identifying protonated pseudomolecular ions ([M+H]+) or alkali metal adducts ([M+Na]+, [M+K]+), which appear 1, 23, or 39 mass units higher than the true neutral molecular mass.
- MS1 vs MS2 in Tandem Mass Spectrometry (MS/MS): In complex LC-MS workflows, tandem mass spectrometry uses two mass analysers in series. The first analyser (MS1) filters and isolates a specific intact precursor ion. This ion enters a collision cell filled with inert argon gas, undergoing Collision-Induced Dissociation (CID) to yield product ions that are subsequently resolved and recorded by the second analyser (MS2).
Understanding Peaks in Mass Spectrometry: Molecular Ion vs Base Peak
The Molecular Ion Peak (Parent Ion / M+ Peak)
The molecular ion peak, historically designated as the parent ion peak mass spec signal and symbolised as M⁺• or M⁺, represents the intact radical cation formed when a neutral molecule loses a single electron without undergoing subsequent bond cleavage.
                                  Molecular Ion Formation
                M (Neutral Molecule) + e⁻ (70 eV)  ──►  [M]⁺• + 2 e⁻
Because the mass of an electron (≈ 0.00055 Da) is negligible relative to the total mass of the molecule, the (m/z) position of the (M+) peak directly reveals the relative formula mass (molecular weight) of the analyte.
Understanding how to calculate molecular ion peak positions requires locating the highest nominal (m/z) signal in the spectrum, excluding minor isotope satellite peaks (M+1) and (M+2). For instance, in the mass spectrum of pentane (C₅H₁₂), the molecular ion appears at (m/z = 72), matching its calculated molecular weight of 72 g/mol. Analysts confirm the validity of a candidate M+ peak by verifying that observed fragment losses correspond to logical chemical groups, such as:
- M - 15: Loss of a methyl radical (CH₃•).
- M - 18: Loss of a neutral water molecule (H₂O).
- M - 29: Loss of an ethyl radical (C₂H₅•) or formyl radical (CHO•).
- M - 45: Loss of an ethoxy radical (OCH₂CH₃•) or carboxyl group (COOH•).
Conversely, gaps of 3 to 14 mass units below a candidate M+ peak indicate an invalid assignment, as losing fragments of 3 to 14 mass units is chemically improbable under unimolecular decay rules. In compounds containing labile hydrogen atoms such as aldehydes, alcohols, primary amines, and nitriles, the molecular ion peak is frequently accompanied by a prominent M - 1 peak caused by the rapid expulsion of a hydrogen radical (H•) from the α-carbon or heteroatom.
The Base Peak: Definition and Identification
The base peak is defined as the tallest, most intense signal in a mass spectrum. In spectral post-processing, the detector signal of the base peak is arbitrarily assigned a relative abundance value of 100%. All other fragment line heights across the spectrum are normalised and reported as a percentage relative to this 100% baseline.
                 Relative Abundance (%) = (Peak Height / Base Peak Height) × 100
                 Base Peak Relative Abundance ≡ 100%
The base peak represents the most abundant and stable fragment ion produced during unimolecular decomposition. High base peak intensity occurs because the corresponding fragmentation pathway possesses a low activation energy barrier, or because the resulting product ion is stabilised by resonance or inductive electron delocalisation. Common stable species that frequently form the base peak include:
- Tertiary Carbocations: E.g., the tert-butyl cation [(CH₃)₃C]⁺ at m/z = 57.
- Resonance-Stabilised Acylium Ions: E.g., the propionyl cation [CH₃CH₂CO]⁺ at m/z = 57 in pentan-3-one.
- Oxonium and Iminium Ions: E.g., [CH₂=OH]⁺ at m/z = 31 in primary alcohols, or [CH₂=NH₂]⁺ at m/z = 30 in primary aliphatic amines formed via α-cleavage.
- Tropylium Cations:
The aromatic seven-membered cycloheptatrienyl cation [C₇H₇]⁺ at m/z = 91 formed in alkylbenzenes.
Molecular Ion Peak vs Base Peak (Key Differences)
Evaluating the molecular ion peak vs base peak highlights fundamental differences between molecular mass identification and structural stability analysis.
| Parameter | Molecular Ion Peak (M⁺) | Base Peak |
|---|---|---|
| Primary Definition | Signal representing the unfragmented radical cation (M⁺•). | Signal with the highest intensity (100% relative abundance). |
| (m/z) Position | Located at the highest nominal (m/z) value (excluding (M+1) and (M+2)). | Can occur at any (m/z) position across the spectrum. |
| Physical Significance | Directly provides the relative formula mass (molecular weight). | Identifies the most abundant and stable fragment ion. |
| Relative Intensity | Variable; ranges from 100% down to 0% (undetectable). | Fixed at exactly 100% by definition. |
| Structural Dependency | High in aromatics and cyclic systems; weak/absent in branched alkanes and tertiary alcohols. | Governed by carbocation stability and favourable rearrangement pathways. |
While the molecular ion peak can sometimes serve as the base peak in highly stable aromatic hydrocarbons (e.g., benzene or naphthalene, where M+ is resilient to fragmentation), in the vast majority of organic compounds the molecular ion undergoes rapid cleavage, making the base peak a smaller daughter fragment.
Isotope Patterns and Diagnostic Peaks (M+1 and M+2)
The M+1 Peak: Calculating Carbon Count
Due to the natural existence of stable heavy isotopes, mass spectra display small satellite peaks directly above the monoisotopic molecular ion. The M+1 peak arises primarily from the presence of Carbon-13 (13C), which has a natural isotopic abundance of approximately 1.1% relative to Carbon-12 (12C).
                         Carbon Count Formula (nC):
                 nC ≈ [ Height of (M+1)⁺ / Height of M⁺ ] × (100 / 1.1)
Because each carbon atom in an organic molecule carries a 1.1% statistical probability of being a 13C isotope, the height of the M+1 peak increases linearly with the total number of carbon atoms present. For example, a molecule containing 10 carbon atoms will display an M+1 peak height that is approximately 11% (10*1.1%) of the intensity of the M+ peak. Dividing the relative intensity ratio of (M+1)+ / M+ by 0.011 provides a rapid mathematical estimation of the number of carbon atoms (nC) within the molecular framework.
The M+2 Peak: Identifying Chlorine, Bromine, and Sulfur
Elements possessing heavy stable isotopes separated by two mass units generate characteristic M+2 satellite clusters. Evaluating the M+2 peak chlorine-to-bromine intensity ratio allows immediate identification of halogenated functional groups:
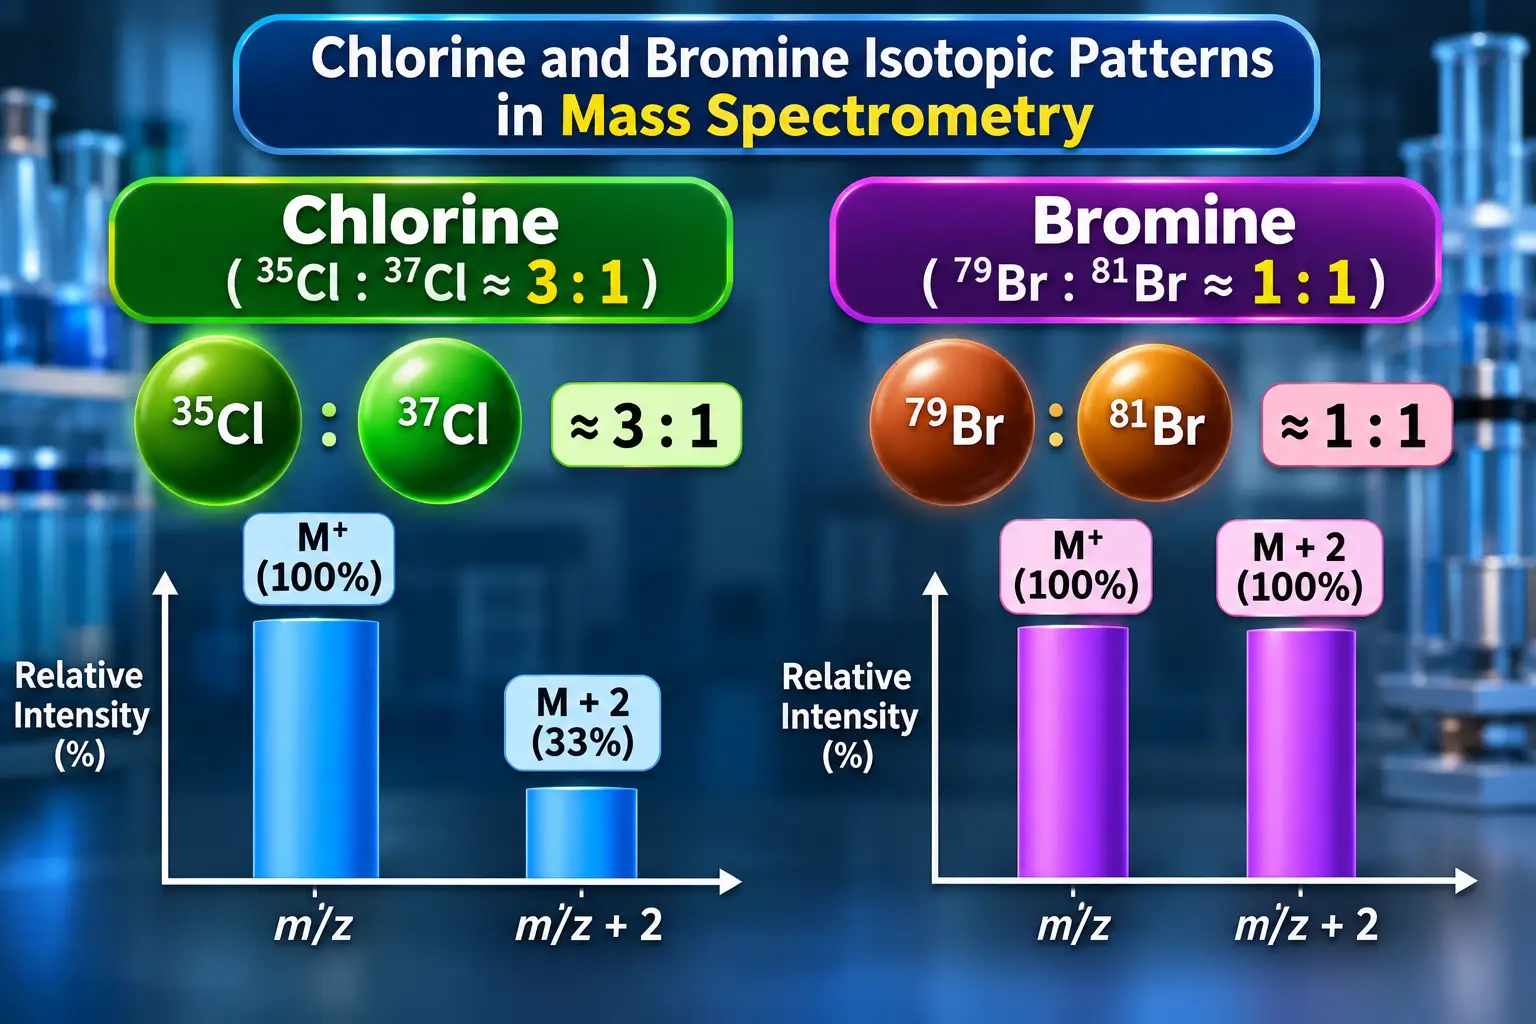
- Single Chlorine Atom: Chlorine naturally exists as two isotopes: 35Cl (75.5%) and 37Cl (24.5%). Compounds containing one chlorine atom display an M+2 peak that is one-third the height of the M+ peak, establishing a diagnostic 3:1 ratio.
- Single Bromine Atom: Bromine consists of two near-equally abundant isotopes: 79Br (50.5%) and 81Br (49.5%). Compounds containing one bromine atom exhibit an M+2 peak of virtually identical intensity to the M+ peak, creating a 1:1 doublet ratio.
- Single Sulfur Atom: Sulfur contains a 34S isotope (4.25% natural abundance) alongside 32S (95.0%). Sulfur-containing compounds display a characteristic M+2 peak height that is roughly 4.4% of the M+ signal.
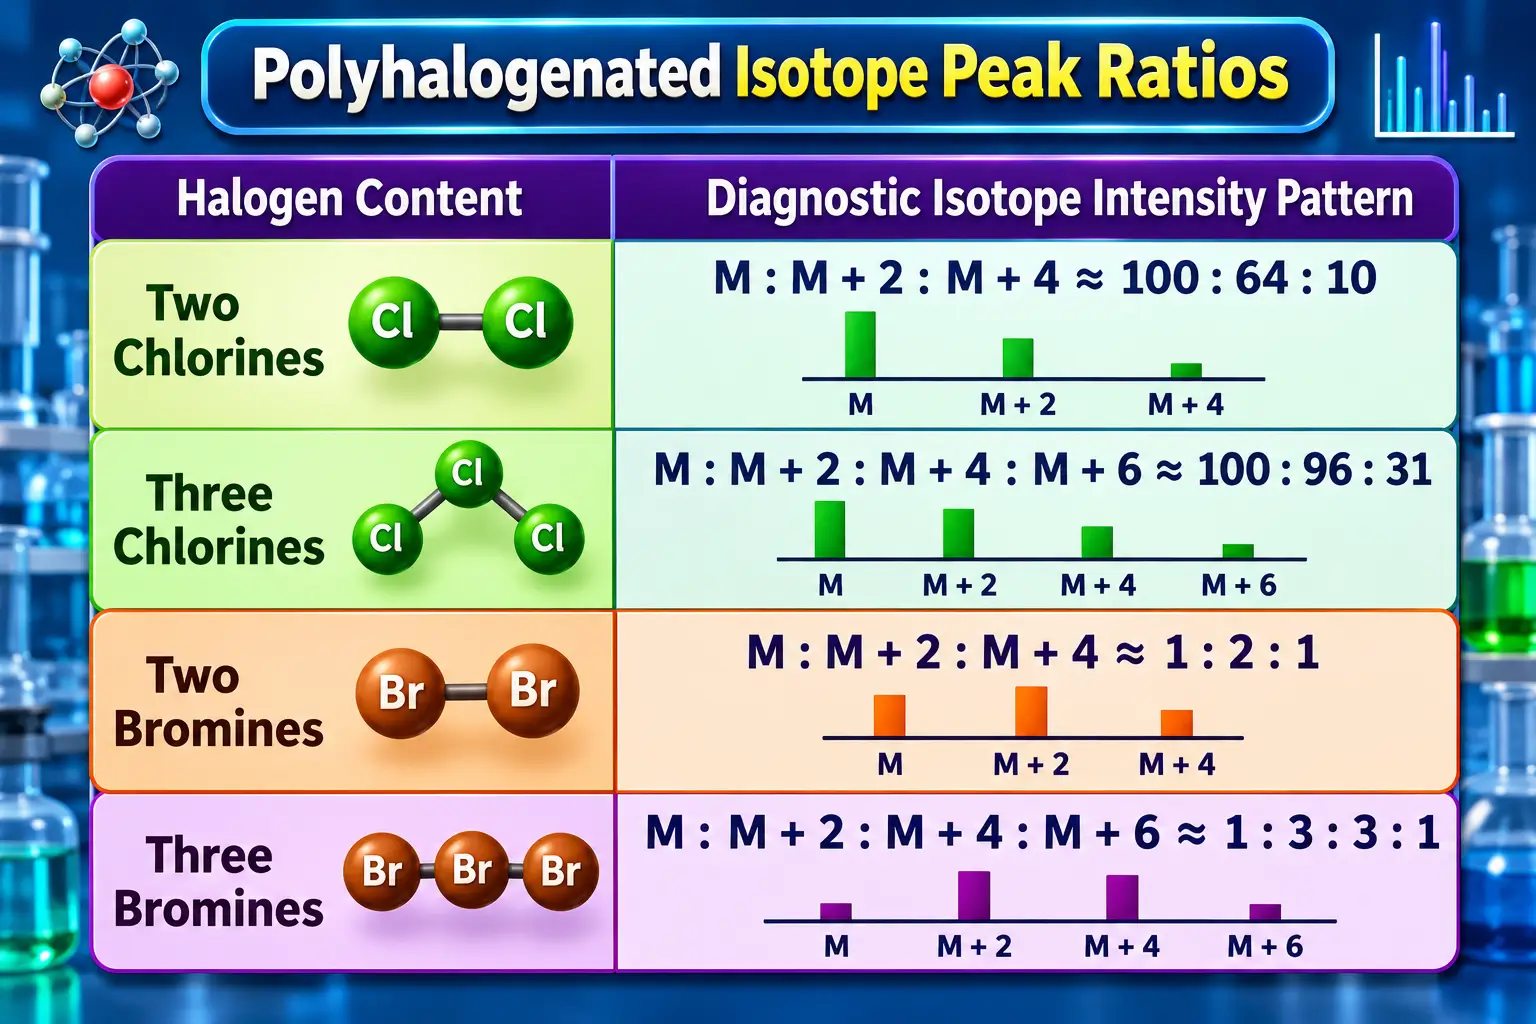
When multiple halogen atoms are present, calculating the M+2 isotope peak chlorine bromine distribution follows binomial expansion mathematics. For dichloromethane (CH2Cl2), polynomial expansion of (0.7576 + 0.2424)2 produces a triplet cluster at m/z = 84, 86, 88 with relative peak intensities of 100: 64: 10. For a dibrominated compound such as 1,2-dibromoethane, the isotope cluster at (m/z = M, M+2, M+4) exhibits a 1: 2: 1 triplet pattern.
Rules for Predicting Mass Spectrometry Fragmentation
What are Molecular Fragments and Fragmentation Patterns?
Unimolecular decomposition reactions inside an Electron Ionisation source convert energetic radical cations into smaller daughter fragments. The simplest cleavage involves breaking a single covalent bond, producing one positively charged cation and one uncharged free radical:
[R - R']⁺• → R⁺ + R'• or R• + R'⁺
Because the mass spectrometer deflects and detects only charged cations, the uncharged radical fragment remains invisible on the spectrum. Evaluating predictable mass spectrometry fragmentation patterns allows analysts to determine whether cleavage occurred via simple α-cleavage, inductive cleavage, or complex hydrogen transfer rearrangements such as the McLafferty rearrangement.
Stevenson’s Rule in Mass Spectrometry
Formulated by David P. Stevenson, Stevenson's rule in mass spectrometry dictates the distribution of positive charge during unimolecular bond cleavage. The rule states:
When a molecular radical cation decomposes via single-bond cleavage, the positive charge preferentially remains on the fragment possessing the lower ionisation energy, while the uncharged radical site forms on the fragment with the higher ionisation energy.
                       Stevenson's Rule Charge Distribution:
        [R — R']⁺•  ──►  R⁺ (Lower Ionisation Energy) + R'• (Higher Ionisation Energy)
Because ionisation energy correlates inversely with carbocation stability, Stevenson's rule practically dictates that bond cleavage will generate the most stable carbocation species. The relative stability hierarchy of aliphatic carbocations is:
Tertiary (3°) > Secondary (2°) > Primary (1°) > Methyl (CH₃⁺)For example, when 2-methylbutane fragments at its branched carbon center, cleavage can yield either a secondary sec-butyl cation (m/z = 57) or a primary methyl radical, versus a primary methyl cation (m/z = 15) and a secondary sec-butyl radical. In accordance with Stevenson's rule, the positive charge resides predominantly on the secondary sec-butyl fragment, generating an intense signal at m/z = 57, while the signal for the high-energy methyl cation at m/z = 15 remains negligible.
The Nitrogen Rule in Mass Spectrometry
The nitrogen rule mass spectrometry principle provides a robust mathematical method for determining the presence or absence of nitrogen atoms based on nominal molecular mass. The rule states:
- An organic compound containing a neutral structure composed of C, H, O, S, P, and halogens will possess an even nominal molecular mass M+ if it contains zero or an even number of nitrogen atoms.
- An organic compound will possess an odd nominal molecular mass M+ if and only if it contains an odd number of nitrogen atoms (1, 3, 5, etc.).
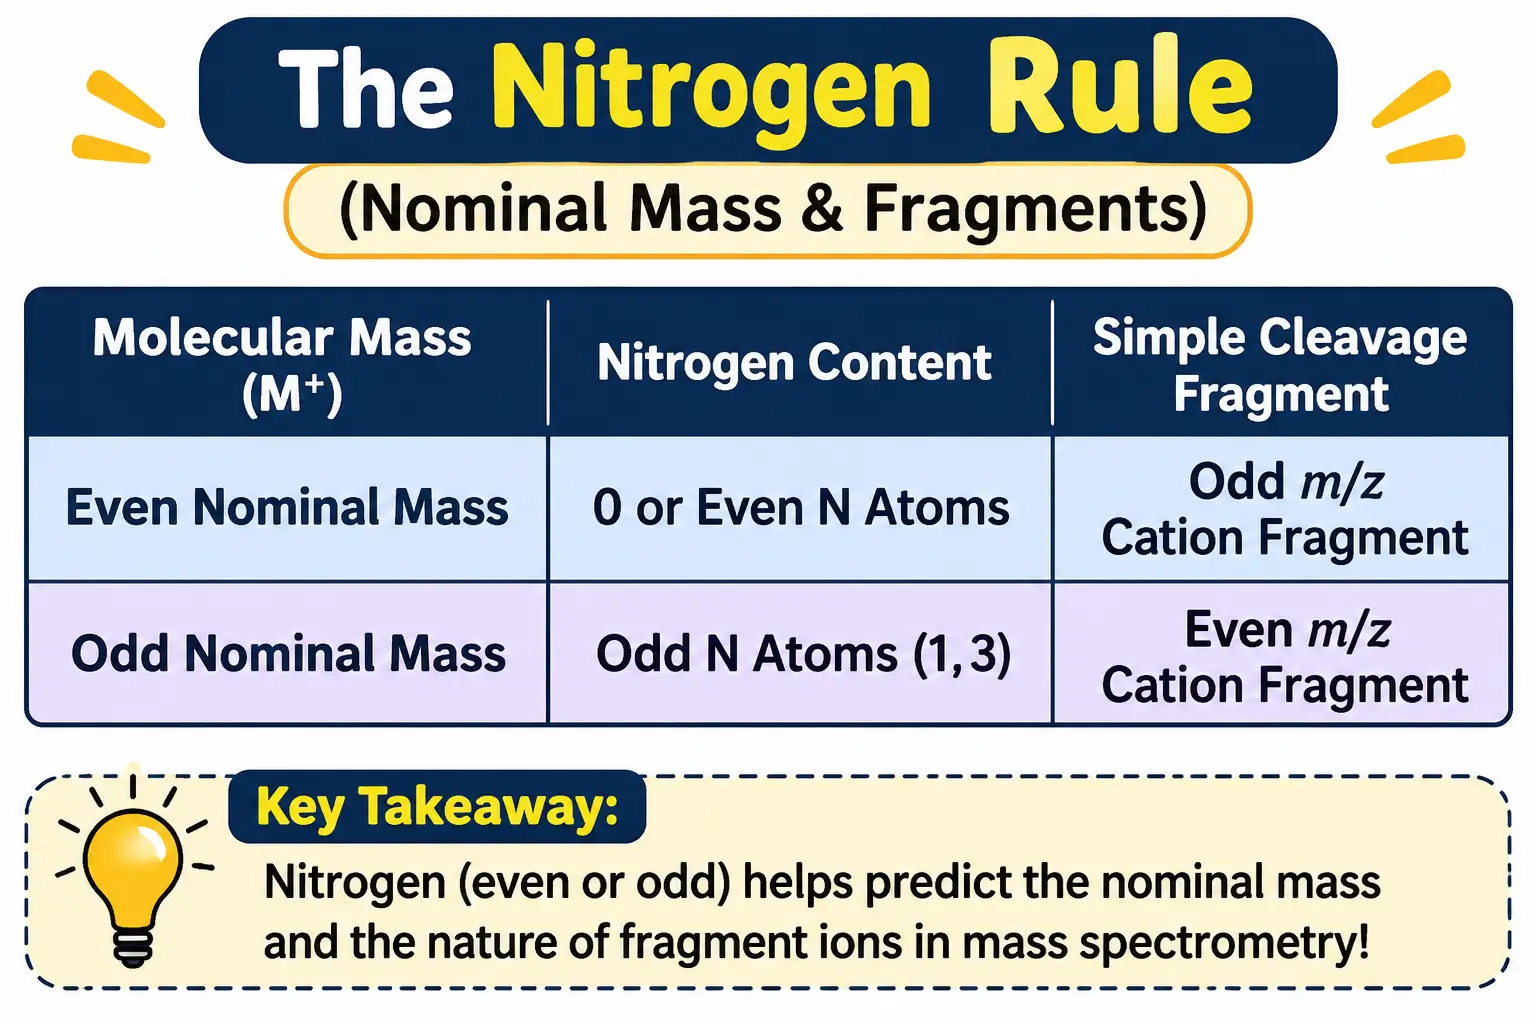
The chemical origin of Nitrogen rule mass spec behaviour lies in nitrogen's unique valence-to-mass relationship. Nitrogen has an even atomic mass (14 Da) but an odd standard valency of 3. By contrast, other common even-mass elements (Carbon = 12 Da, Oxygen = 16 Da, Sulfur = 32 Da) have even valencies (4, 2, 2). Elements with odd atomic masses (Hydrogen = 1 Da, Chlorine = 35 Da, Fluorine = 19 Da) have odd valencies of 1.
A useful extension applies to fragment ions formed via simple single-bond cleavage. An even-mass molecular ion containing no nitrogen splits into an odd-mass cation and an uncharged radical. Conversely, an odd-mass molecular ion containing one nitrogen atom splits into an even-mass nitrogenous cation (if the nitrogen atom remains with the charged fragment).
The Rule of 13 in Mass Spectrometry
Applying the Rule of 13 in mass spectrometry allows chemists to generate candidate hydrocarbon molecular formulae directly from nominal molecular mass. The rule assumes that the organic framework is constructed primarily from base CH units, each having a nominal mass of 13 Da (Carbon = 12 + Hydrogen = 1).
To derive the base hydrocarbon formula for a known molecular mass (M):
- Divide the nominal mass M by 13 to calculate the quotient (n) and remainder (r):
M/13 = n + r/13 - The base hydrocarbon formula is expressed as CnHn+r.
- Calculate the base degree of unsaturation (Rings + π bonds, U): U = (n - r + 2)/2
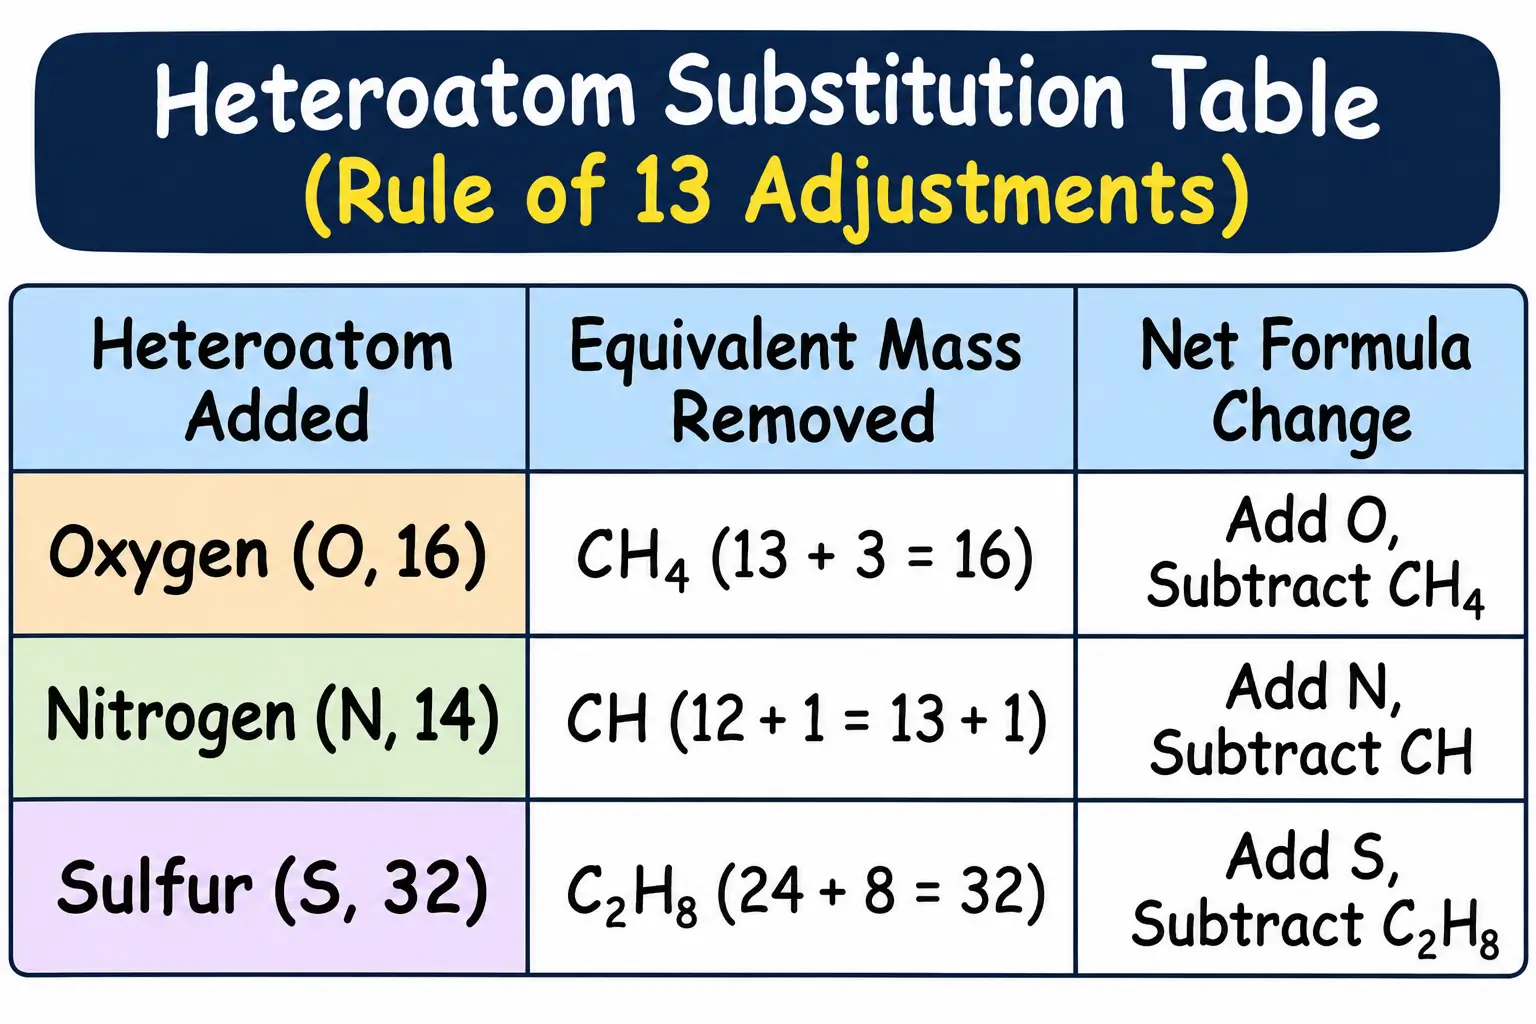
If spectroscopic evidence (e.g., IR or NMR data) indicates the presence of heteroatoms, substitute candidate CHx equivalents from the base hydrocarbon formula:
- To incorporate one Oxygen atom (16 Da), subtract CH4(12+4=16) and add O.
- To incorporate one Nitrogen atom (14 Da), subtract CH(12+1=13) and add N.
- To incorporate one Chlorine atom (³⁵Cl, 35 Da), subtract C₂H₁₁ (24 + 11 = 35) and add Cl.
Analyzing Common Fragmentation Scenarios and Real Examples
What Does a Base Peak of 43 Mean?
A prominent signal at base peak m/z 43 in mass spectrometry is one of the most frequently encountered diagnostic peaks in organic mass spec. Observing a base peak m/z 43 typically points to one of three specific structural moieties:
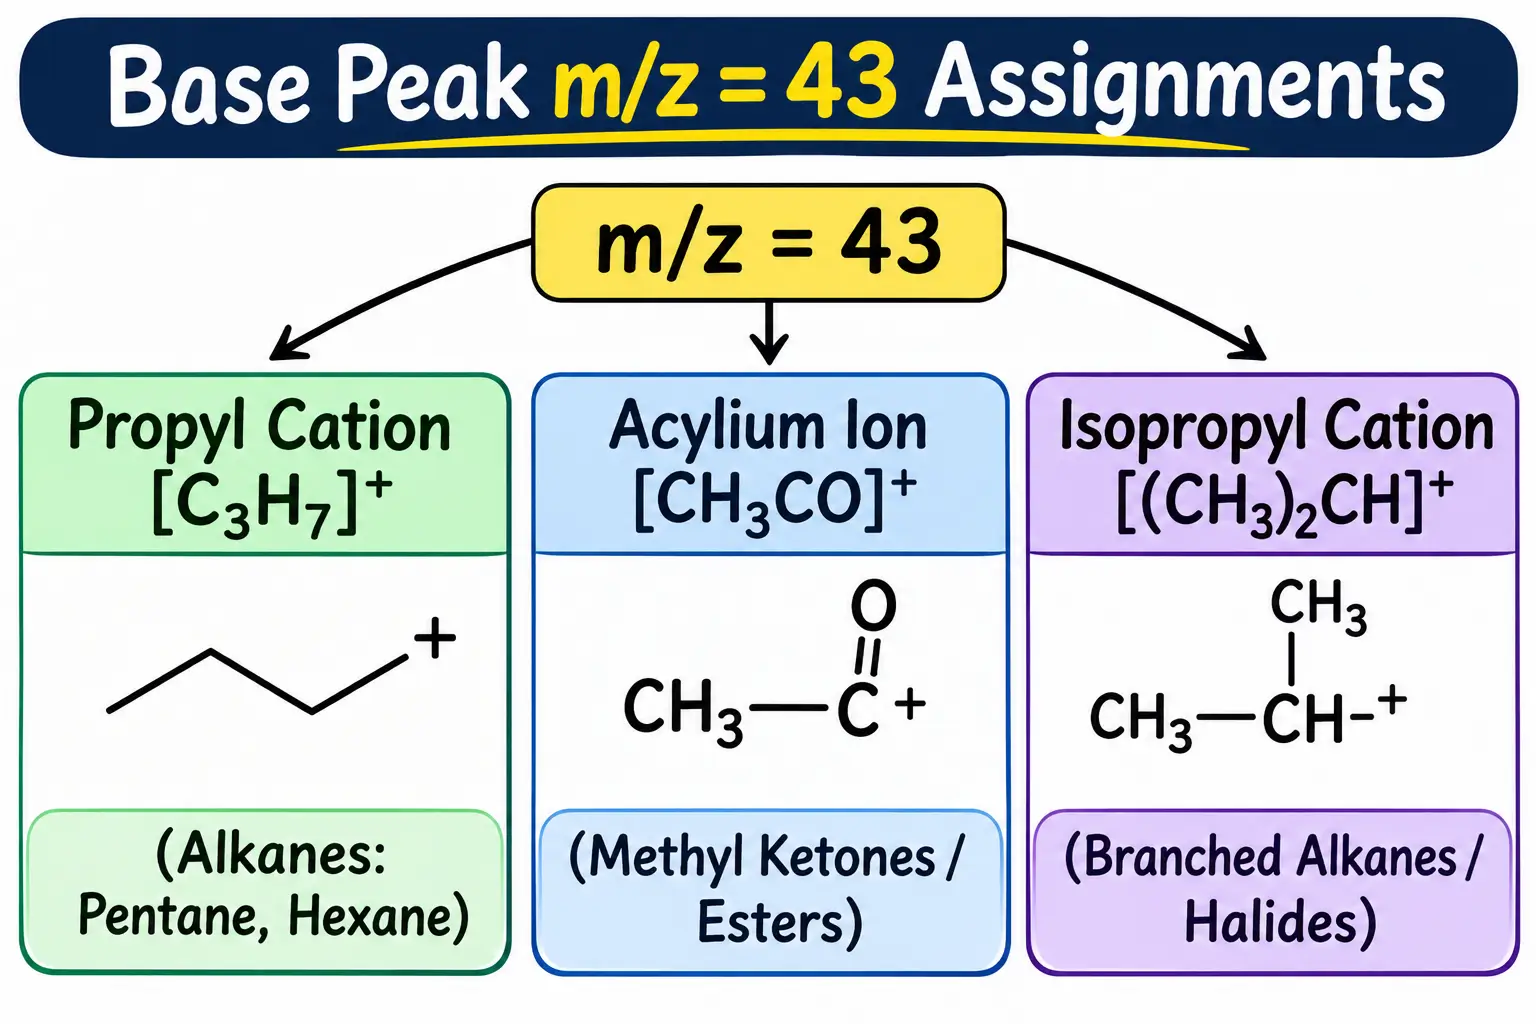
- Propyl Carbocation ([C3H7]+): In unbranched aliphatic alkanes (e.g., pentane or hexane), homolytic cleavage of a C-C bond produces a linear propyl cation (m/z = 43).
- Acetyl Acylium Ion ([CH3CO]+): In methyl ketones (e.g., acetone, pentan-2-one) and methyl esters (e.g., methyl acetate), α-cleavage adjacent to the carbonyl group yields a resonance-stabilised acetyl cation (m/z = 43).
- Isopropyl Carbocation ([CH(CH3)2]+): In branched alkanes (e.g., 2-methylbutane) or secondary alkyl halides (e.g., 2-bromopropane), preferential cleavage at the branched carbon produces a secondary isopropyl cation (m/z = 43).
5 Examples of Molecules and Their Fragmentation Profiles
- Pentane (C₅H₁₂, MW = 72)
Molecular Ion Peak: M⁺• appears as a clear peak at m/z = 72.
Base Peak: m/z = 43, corresponding to the propyl cation [CH₃CH₂CH₂]⁺ formed by C-C bond cleavage.
Major Fragment Cluster: m/z = 57 (butyl cation [C₄H₉]⁺, M-15), m/z = 29 (ethyl cation [C₂H₅]⁺, M-43), and m/z = 15 (methyl cation [CH₃]⁺). - 2-Methylbutane (C₅H₁₂, MW = 72)
Molecular Ion Peak: Faint M⁺• at m/z = 72 due to rapid cleavage at the tertiary branch.
Base Peak: m/z = 43, representing the secondary isopropyl carbocation [(CH₃)₂CH]⁺.
Diagnostic Fragment: Intense peak at m/z = 57 (M-15), corresponding to the secondary sec-butyl cation [CH₃CH₂CH(CH₃)]⁺ formed by preferential loss of a methyl radical. - Pentan-3-one (C₅H₁₀O, MW = 86)
Molecular Ion Peak: Distinct M⁺• at m/z = 86.
Base Peak: m/z = 57, corresponding to the propionyl acylium ion [CH₃CH₂CO]⁺ formed by symmetric α-cleavage on either side of the carbonyl group.
Diagnostic Fragment: m/z = 29, corresponding to the ethyl cation [C₂H₅]⁺. - Toluene (C₇H₈, MW = 92)
Molecular Ion Peak: Intense M⁺• signal at m/z = 92 owing to aromatic stabilisation.
Base Peak: m/z = 91 (M-1), representing the tropylium cation [C₇H₇]⁺ formed by benzylic loss of a hydrogen radical followed by ring expansion into a symmetrical seven-membered aromatic cation.
Diagnostic Fragment: m/z = 65, formed by the neutral elimination of acetylene (HC≡CH, 26 Da) from the tropylium ion. - Bromoethane (C₂H₅Br, MW = 108/110)
Molecular Ion Cluster: Doublet of equal intensities at m/z = 108 (M⁺ containing ⁷⁹Br) and m/z = 110 (M+2 containing ⁸¹Br).
Base Peak: m/z = 29, representing the ethyl cation [C₂H₅]⁺ formed by heterolytic cleavage of the C-Br bond.
Step-by-Step Guide: How to Interpret an Unknown Mass Spectrum
5-Step Checklist for Solving Mass Spec Problems
When evaluating an unknown mass spectrum, following a structured 5-step checklist ensures accurate structural assignments:
    Step 1: Identify M⁺ & Apply Nitrogen Rule
                     │
                     ▼
    Step 2: Check Isotope Clusters (M+1, M+2)
                     │
                     ▼
    Step 3: Locate Base Peak (100% Intensity)
                     │
                     ▼
    Step 4: Calculate Logical Losses (M - X)
                     │
                     ▼
    Step 5: Synthesise Fragmentation Mechanics
- Step 1 — Identify the Molecular Ion M+ and Apply the Nitrogen Rule: Locate the highest nominal (m/z) signal (ignoring minor isotope peaks). Check if the mass is odd or even: an odd M+ mass indicates an odd number of nitrogen atoms, whereas an even M+ mass indicates zero or an even number of nitrogens.
- Step 2 — Evaluate Isotope Patterns (M+1 and M+2): Measure the (M+1)+ / M+ intensity ratio to estimate the carbon count (
nC ≈ %M+1 / 1.1). Inspect the M+2 region for halogen signatures: a 3:1 ratio indicates one chlorine, a 1:1 ratio indicates one bromine, and an elevated ~4.4% peak indicates sulfur. - Step 3 — Locate the Base Peak (100% Relative Abundance): Identify the tallest line in the spectrum. Determine whether the base peak corresponds to a stable tertiary carbocation, an acylium ion (m/z = 43, 57, 105), an oxonium/iminium ion (m/z = 31, 30), or a tropylium ion (m/z = 91).
- Step 4 — Calculate Logical Mass Losses:
Subtract major fragment (m/z) values from the molecular ion mass (M - Fragment). Check for characteristic losses such as M-15 (CH₃•), M-18 (H₂O), M-28 (CO or C₂H₄), M-31 (OCH₃•), or M-45 (COOH•). - Step 5 — Synthesise Fragmentation Pathways and Verify Structure: Cross-reference observed fragments with established cleavage mechanics (Stevenson's Rule, α-cleavage, McLafferty rearrangement). Reconstruct candidate molecular structures and confirm that all observed spectral peaks match the proposed fragmentation profile.
By mastering mass spectrometry fragmentation patterns, isotopic ratios, and unimolecular decay rules, chemists can decipher unknown spectra and determine molecular structures with high precision.
Frequently Asked Questions
What is the difference between a base peak and a molecular ion peak (parent peak)?
The molecular ion peak (M⁺) represents the unfragmented radical cation (M⁺•) located at the highest nominal m/z value, providing the exact relative formula mass of the molecule. In contrast, the base peak is the tallest, most intense peak in the spectrum (assigned 100% relative abundance), representing the most stable and abundant fragment ion produced during unimolecular decomposition. While M⁺ can sometimes be the base peak in stable aromatic systems, it is often weak or absent in branched alkanes and alcohols.
What does a base peak at m/z = 43 mean in mass spectrometry?
A prominent base peak at m/z = 43 is a classic diagnostic signal in organic mass spec. It typically points to one of three structures: a linear propyl cation [C₃H₇]⁺ in unbranched alkanes, a resonance-stabilised acetyl acylium ion [CH₃CO]⁺ in methyl ketones and esters, or a branched isopropyl carbocation [(CH₃)₂CH]⁺ in branched hydrocarbons.
What is the Rule of 13 in mass spectrometry and how is it used?
The Rule of 13 is a mathematical method used to deduce candidate molecular formulae from a known nominal molecular mass (M). By dividing M by 13 (assuming a base CH unit mass of 12 + 1 = 13), you get a quotient (n) and remainder (r), yielding the base hydrocarbon formula CₙH₍ₙ₊ᵣ₎. Heteroatoms like Oxygen, Nitrogen, or Chlorine can then be incorporated by substituting equivalent CHₓ units (e.g., subtracting CH₄ to add O).
What causes an M-1 peak in mass spectrometry?
An M-1 peak (or parent minus one mass unit) is caused by the rapid expulsion of a hydrogen radical (H•) from the molecular ion. This is particularly prominent in compounds containing labile hydrogens or stable carbocation pathways, such as aldehydes (losing formyl or aldehydic H), primary alcohols, and alkylbenzenes (where toluene forms the highly stable tropylium ion at m/z = 91).
What are the 5 stages of mass spectrometry?
The operation of a standard mass spectrometer involves five sequential stages under high vacuum:
Sample Inlet & Vapourisation (converting sample into gas phase),
Ionisation (electron bombardment at 70 eV to form radical cations),
Acceleration (focusing ions into a uniform beam),
Deflection / Mass Analysis (sorting ions by m/z ratio using magnetic or electric fields), and
Detection & Signal Processing (recording ion abundance to generate the final spectrum).
What are the key differences between optical spectroscopy and mass spectrometry?
While optical spectroscopic methods (such as UV-Vis or IR spectroscopy) measure the absorption or emission of electromagnetic radiation through non-destructive energy transitions, mass spectrometry is a micro-destructive analytical technique. It physically ionises neutral molecules into gas-phase ions, fragments their chemical bonds, and separates them based on their mass-to-charge ratio (m/z).

Founder · CrazyForChem
Chemistry Educator | Organic Chemistry Expert | M.Sc. Organic Chemistry
Helping Students & Teachers Master Chemistry. I’m a passionate chemistry educator who loves making chemistry simple, relatable, and fun. With a background in Organic Chemistry, I help students not only understand concepts but also explore the many career paths chemistry can lead to.